Python
[Python] matplotlib, seaborn 막대그래프 그리기 / 꾸미기
개발자열무
2023. 4. 17. 17:30
반응형
🎈 구글 드라이브 - colab 연동
from google.colab import drive
drive.mount('/content/drive')
🎨 tips data 불러오기
import matplotlib.pyplot as plt
import seaborn as sns
import numpy as np

tips = sns.load_dataset('tips')
tips.head()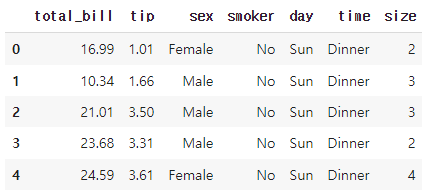
✌ 축 포맷팅
# 축 포맷팅 (함수 지정)
from matplotlib.ticker import (MultipleLocator, AutoMinorLocator, FuncFormatter)
def major_fomatter(x, pos):
  return "%.2f+$" % x

formatter = FuncFormatter(major_fomatter)
✌ plot 그리기 세팅
fig, ax = plt.subplots(nrows = 1, ncols = 2, figsize=(16,5))
sns.barplot(x = 'day'
            , y= 'total_bill'
            , data = tips
            , errorbar = None
            , color = 'lightgray'
            , alpha = 0.85
            , ax = ax[0]
            )

plt.show()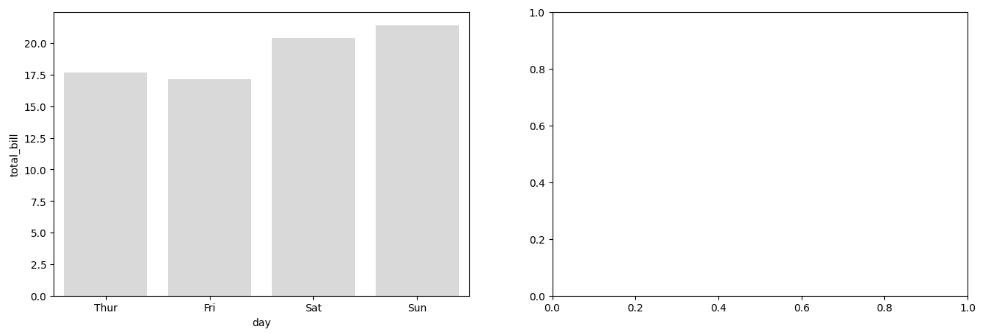
✌ 원하는 조건으로 추출하기
# 해당되는 것만 추출하기 (요일, 값)
group_mean = tips.groupby(['day'])['total_bill'].agg('mean')
# print(group_mean)

h_day = group_mean.sort_values(ascending = False).index[0]
h_mean = np.round(group_mean.sort_values(ascending = False).values[0],2)
h_mean
✌ 막대 그래프 그리기 / 꾸미기
fig, ax = plt.subplots(nrows = 1, ncols = 2, figsize=(16,5))
ax0 = sns.barplot(x = 'day'
, y= 'total_bill'
, data = tips
, errorbar = None
, color = 'lightgray'
, alpha = 0.85
, ax = ax[0]
)
h_day = group_mean.sort_values(ascending = False).index[0]
h_mean = np.round(group_mean.sort_values(ascending = False).values[0],2)
print(h_day, h_mean)
for p in ax0.patches:
fontweight = 'normal'
color = '#7C57FF'
height = np.round(p.get_height(), 2)
if h_mean == height:
fontweight = 'bold'
color = '#E74FFE'
p.set_facecolor(color)
p.set_edgecolor("#FF4141")
ax0.text(p.get_x() + p.get_width()/2.,
height+1,
height,
ha = 'center',
size=12,
fontweight=fontweight,
color=color)
ax0.set_ylim(-3, 30)
ax0.set_title('Bar Graph', size = 16)
# 네모 박스 선 없애기
ax0.spines['top'].set_visible(False)
ax0.spines['right'].set_visible(False)
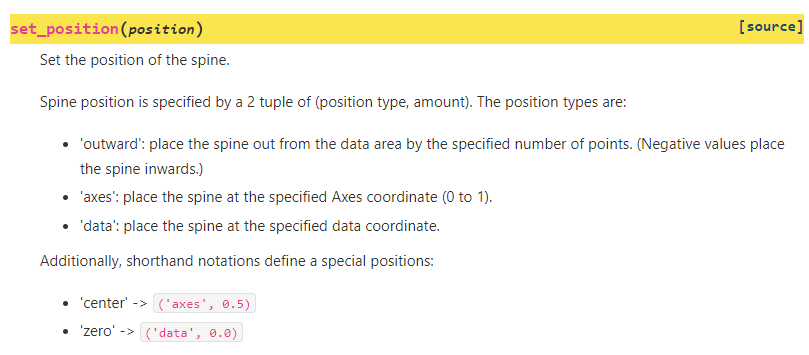
ax0.spines['left'].set_position(('outward', 20))
ax0.spines['left'].set_visible(False)
# y축 조정
ax0.yaxis.set_major_locator(MultipleLocator(10))
ax0.yaxis.set_major_formatter(formatter) # formatter 형태에 맞게 변형 ($ 표시)
ax0.yaxis.set_minor_locator(MultipleLocator(5))
plt.show()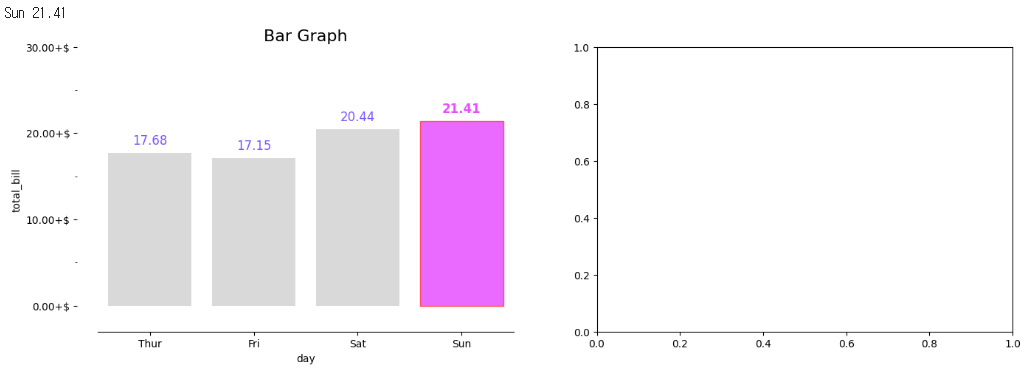
📢 set_positon()
💡 Upgrade Graph
# upgrade
import matplotlib.pyplot as plt
from matplotlib.ticker import (MultipleLocator, AutoMinorLocator, FuncFormatter)
import seaborn as sns
import numpy as np

# 데이터 불러오기
tips = sns.load_dataset("tips")

# 시각화 객체지향선언
fig, ax = plt.subplots(nrows = 1, ncols = 2, figsize=(16, 5))

def major_formatter(x, pos):
    return "%.2f$" % x
formatter = FuncFormatter(major_formatter)

# Ideal Bar Graph
ax0 = sns.barplot(x = "day", y = 'total_bill', data = tips,
                  ci=None, color='lightgray', alpha=0.85, zorder=2,
                  ax=ax[0])

group_mean = tips.groupby(['day'])['total_bill'].agg('mean')
h_day = group_mean.sort_values(ascending=False).index[0]
h_mean = np.round(group_mean.sort_values(ascending=False)[0], 2)
for p in ax0.patches:
  fontweight = "normal"
  color = "k"
  height = np.round(p.get_height(), 2)
  if h_mean == height:
    fontweight="bold"
    color="darkred"
    p.set_facecolor(color)
    p.set_edgecolor("black")
  ax0.text(p.get_x() + p.get_width()/2., height+1, height, ha = 'center',
           size=12,
           fontweight=fontweight, color=color)

ax0.set_ylim(-3, 30)
ax0.set_title("Ideal Bar Graph", size = 16)

ax0.spines['top'].set_visible(False)
ax0.spines['left'].set_position(("outward", 20))
ax0.spines['left'].set_visible(False)
ax0.spines['right'].set_visible(False)

ax0.yaxis.set_major_locator(MultipleLocator(10))
ax0.yaxis.set_major_formatter(formatter)
ax0.yaxis.set_minor_locator(MultipleLocator(5))

ax0.set_ylabel("Avg. Total Bill($)", fontsize=14)

ax0.grid(axis="y", which="major", color="lightgray")
ax0.grid(axis="y", which="minor", ls=":")

ax0.set_xlabel("Weekday", fontsize=14)
for xtick in ax0.get_xticklabels():
  print(xtick)
  if xtick.get_text() == h_day:
    xtick.set_color("darkred")
    xtick.set_fontweight("demibold")
ax0.set_xticklabels(['Thursday', 'Friday', 'Saturday', 'Sunday'], size=12)

ax1 = sns.barplot(x = "day", y = 'total_bill', data = tips,
                  errorbar=None, alpha=0.85,
                  ax=ax[1])
for p in ax1.patches:
  height = np.round(p.get_height(), 2)
  ax1.text(p.get_x() + p.get_width()/2., height+1, height, ha = 'center', size=12)
ax1.set_ylim(-3, 30)
ax1.set_title("Just Bar Graph")

fig.show()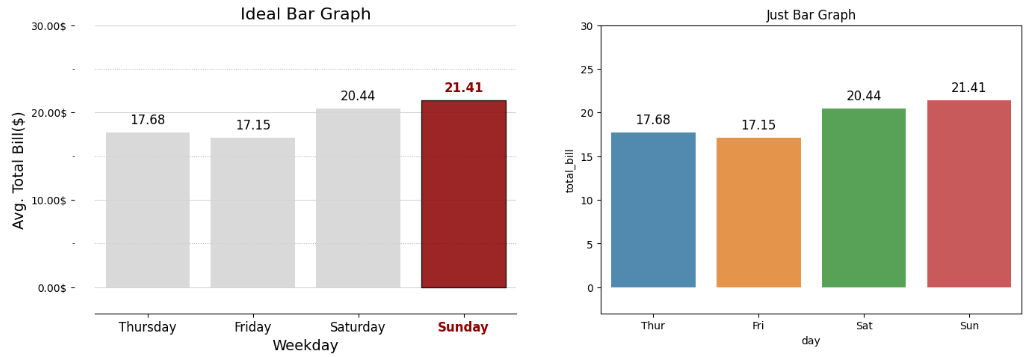
반응형